Issue 038, June 20, 2022
Megan K. Puglia, Ph.D., Sr. Research Chemist
The hardness value of a material is an indicator of its resistance to plastic deformation and wear, where materials with larger values demonstrate an increased resistance to deformation. As the name implies, microhardness measurements allow for the hardness testing of small material components or small sections of larger components, such as surface layers or specific microstructural components. Like macrohardness measurements, the microhardness value assignment involves the measurement of an indentation made by an indenter lowered slowly into another material under a specific applied load and hold time. The indentation is measured with a calibrated optical microscope. Two main microhardness tests exist depending on the shape of the indenter used known as Knoop and Vickers.
Knoop microhardness testing involves the use of a pyramidal diamond indenter, where the long diagonal of the rhombus-shaped indentation is used to convert to a Knoop Hardness number (HK). The Knoop hardness number correlates the applied test load and measured length of the rhombus diagonal as described in Equation 1.¹

Vickers microhardness testing utilizes a square pyramidal diamond indenter, where the surface area of the square indentation is measured and in conjunction with the load is converted to a Vickers Hardness number (HV) (Equation 2).¹ Vickers, also referred to as Diamond Pyramid Hardness (DPH), is often called out in noble metal alloy specifications.


Figure 1: A. Microhardness test set-up demonstrating a Knoop indentation. Inset shows sample mount, Knoop and Vickers indenters as well as microscope objective on instrument swivel. B. Knoop versus Vickers indentations for 100, 50, and 25 gram loads. Figure 1 adapted from Pitney, 2022.¹
Vickers and Knoop microhardness testing can be completed on the same microhardness testing set-up by just changing the indenter used on the microscope (Figure 1A). In Figure 1B the differences between Knoop and Vickers indentations under three loads are highlighted. Both types of hardness test indentations increase in surface area under increasing loads. However, the short Knoop diagonal remains shorter than the Vickers diagonal, no matter the load, which is helpful for testing very small wire diameter samples. Unfortunately, there exists no direct conversion between Vickers and Knoop microhardness measurements and attempts to convert hold significant error.
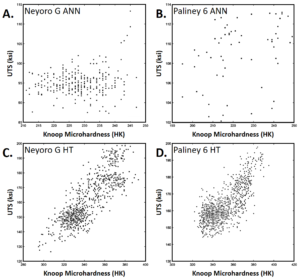
Figure 2: UTS versus Knoop microhardness measurements for annealed (ANN) Neyoro G (A), annealed Paliney 6 (B), age hardened (HT, for “heat treated”) Neyoro G (C), and age hardened Paliney 6 (D). UTS data collected using Instron frames and BlueHills software. Knoop hardness data collected using Leco microhardness test apparatus. Samples of various sizes are represented in all plots.
Knoop and Vickers microhardness tests yield hardness numbers that are a composite of several material properties including material work-hardening rate, ductility, proportional limit, tensile strength, modulus of elasticity, and shear strength, amongst other properties. Although both tensile testing and hardness measurements are material strength measurements, they are not reliably comparable. Hardness testing averages the strength of a material over the indentation surface, whereas tensile testing measures the strength at the weakest point in a sample cross-section. Broadly, samples with high hardness values tend to have increased ultimate tensile strengths and proportional limits, however material temper and history plays a role in these values.
Figure 2 highlights the deviations in linearity between ultimate tensile strength (UTS) measurements and Knoop hardness measurements collected from the same material test samples for both annealed and heat-treated NeyoroTM G and Paliney® 6. In Figure 2A and 2B the UTS versus Knoop hardness plot for both Neyoro G and Paliney 6 samples in the annealed conditions shows nearly no predictable relationship between hardness values and UTS values. Alternatively, Figure 2C and 2D show the same two alloys in the heat treated condition where an increase in hardness loosely corresponds to an increase in UTS values for the same test sample. Overall Figure 2 stresses the dangers in extrapolating tensile data from hardness data without a robust understanding of the material and material processing history.
When choosing between tensile testing and hardness testing for a sample, often times tensile testing will be chosen due to the test yielding several material properties at once, such as elongation, yield strength, and ultimate tensile strength. However, microhardness testing can be done on small, irregularly shaped parts to confirm correctness of final temper and material strength when tensile test pieces are not available. Deringer-Ney is long experienced in fabricating materials meeting the specific tensile and hardness properties required by our customers.
References:
1. Pitney KE. Hardness. In: Ney Contact Manual, Revised 1st Ed: Properties of Materials. Bloomfield,
Connecticut: The J.M. Ney Company; 2022. p. 62-68.