Issue 048, June 22, 2023
Wade A. Jensen, Ph.D., Sr. Research Metallurgist
Phase diagrams are predictive tools that Deringer-Ney metallurgists use to design complex and commercially useful alloys. Despite their effectiveness¹, not every alloy combination has been mapped as there are nearly 4,200 possible binary combinations and over 125,000 possible ternary combinations (including elements up to uranium only). Diagrams for commonly used alloy systems can be found through ASM International²,³, but there are still many gaps for uncommon combinations. To estimate the behavior of unknown alloy systems during development, metallurgists commonly use Hume-Rothery rules to predict solubility and behavior.
These rules were developed by the work of William Hume-Rothery, a physical chemist in 1933. Hume-Rothery’s early work began with Cu/Ag and B-group binary systems, where he discovered that melting temperature, properties, and solid solubility limits could be somewhat accurately predicted from first principles⁴. His finding led to the development of a basic set of criteria that describe conditions of which binary systems can form solid solutions. These rules are not laws; they are neither universal nor perfect, but they are invaluable in predicting the solubility of alloy systems. The rules are as follows⁵:
Rule 1 – Atomic Radii: A substitutional solid solution can only occur if the atomic radii of solvent and solute atoms are similar. The empirical rule is that mismatch can be no greater than 15%; larger mismatches create sufficient lattice strain that promotes the creation of secondary phases to reduce internal energy. Figure 1 is the original figure taken from William Hume-Rothery’s publication and depicts the sizes favorable for Ag and Cu solid solutions⁶.
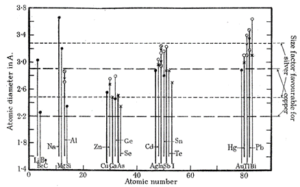
Figure 1: Favorable atomic radii for Ag and Cu solid solutions for select elements⁵.
Rule 2 – Crystal Structure: The constituent elements should have similar crystal structures. Noble metals have either a face centered cubic (FCC) or hexagonal close packed (HCP) crystal structure, see Figure 2. While these unit cells look different, the stacking sequence of the close packed planes, {111} family for FCC and the (0001) for HCP, are structurally similar. These two crystal structures do not exhibit complete miscibility but significant solubility can still occur for some systems. It should be noted that the more complicated crystal structures of intermetallic alloys can also exhibit solid solubility.
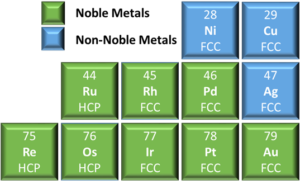
Figure 2: Truncated periodic table of elements showing the crystal structures of
pure noble and select non-noble metals.
Rule 3 – Valency: Maximum solubility occurs for mixtures of similar valency. However, a solvent can incorporate more solute with higher valency than one with lower valency. Elements outside of the transition metals have valencies associated with their group, but this trend does not hold for transition metals (groups 3-12) as multiple valence states are possible, Figure 3. This is caused by the similar energies of (n)d orbitals and the (n+1)s orbitals that allows the d orbital electrons to participate in bonding.
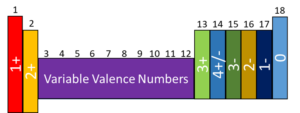
Figure 3: Periodic table of elements showing the valency for each column.
Rule 4 – Electronegativity: Maximum solubility occurs when the electronegativity difference approaches 0. Tends in the periodic table of elements shows that electronegativity increases from the top to bottom and left to right. The greater the electronegativity the greater the likelihood of intermetallic compound formation. Due to their similar electronegativities, noble metals do not form intermetallics with each other, with the possible exception of Ag-Pt alloys. However, many elements outside of the precious metals group will form intermetallics, such as Ag3Al, Au2Ga, WRe3, etc. A Darken-Gurry map, Figure 4, shows electronegativity vs atomic radius for noble and select non-noble elements; groupings here suggest greater solubility.
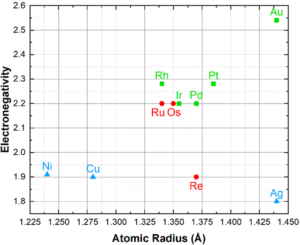
Figure 4: Darken-Gurry Map of noble and select non-noble elements, depicting the electronegativity
vs atomic radius. Noble metals are green squares for FCC and red circles for HCP. Non-noble metals
are blue triangles.
As previously mentioned, these rules are not perfect and there are alloy systems that break the trend; a table of solubility can be found in Figure 5. Examples of dissent are: 1) the large atomic mismatch between Ag and Au suggests immiscible, but in reality they are completely miscible; 2) Ag and Cu have less than 15% mismatch and similar electronegativities, but are completely immiscible at low temperatures; 3) Au and Ni have a large mismatch in electronegativity and lattice size, but still form a miscible system at elevated temperatures; and 4) Ag and Pd are completely miscible, but Ag and Pt are only partially miscible, despite the similarities in radius and electronegativity.
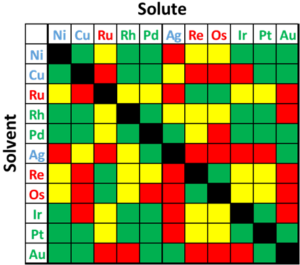
Figure 4:Diagram depicting solid solubility of binary noble and select non-noble systems. Green depicts complete solubility, yellow depicts max solubility greater than 10 at%, and red depicts max solubility below 10 at%. Colored chemical symbols denote noble FCC (green) and HCP (red), and non-noble FCC (blue).
These guidelines allow Deringer-Ney engineers to leverage complex alloying behaviors to create innovative alloys for demanding applications.
Paliney® and Neyoro™ are registered trademarks of Deringer-Ney Inc.
References:
- W. Jensen, Tech Brief 028 – How to Interpret Binary Alloy Phase Diagrams, in: Deringer-Ney Tech Brief, 2022. https://deringerney.com/how-to-interpret-binary-alloy-phase-diagrams/.
- Alloy Phase Diagrams, in: ASM Handbook, ASM International, n.d.
- ASM Alloy Phase Diagram Database, (n.d.). https://matdata-s.asminternational.org/apd/index.aspx.
- G.V. Raynor, William Hume-Rothery 1899-1968, in: Biographical Memoirs of Fellows of the Royal Society, n.d.: pp. 108–139. https://royalsocietypublishing.org/ (accessed August 9, 2022).
- W. Callister, 4.3 Impurities in Solids, in: Materials Science and Engineering and Introduction, 7th ed., John Wiley and Sons, Inc., 2007: pp. 83–85.
- W. Hume-Rothery, The Freezing Points, Melting Points, and Solid Solubility Limits of the Alloys of Silver and Copper with the Elements of the B Sub-Groups, Philosophical Transactions of the Royal Society of London. 223 (1933). https://doi.org/10.1098/rsta.1934.0014.7