Issue 028, February 8, 2022
Wade A. Jensen, Ph.D., Sr. Research Metallurgist
Binary alloy phase diagrams are “maps” used by metallurgists to understand the behavior of two element mixtures by relating composition and temperature to microstructure. A precious metal alloy can have different phases (gas, liquid, or solid allotropes) depending on its temperature and composition. By changing these parameters, the microstructure and properties can be engineered and optimized. Phase diagrams provide a wealth of information about equilibrium phases and the effects of processing on microstructure.
Binary diagrams have two axes, as seen in Figure 1. The x-axis is the bulk composition, either in weight percent (wt%) or atomic percent (at%), of the system; at 100 at% the material is pure Au and at 0 at% the material is pure Ag. The y-axis is the temperature of the system. The diagram depicts the phases at equilibrium, but is unable to describe the time required for equilibrium to be achieved. For example, it is possible to lock in high temperature phases at room temperature through rapid quenching. These phases are metastable and will eventually transform into its equilibrium state.
Miscible System —Figure 2: Annotated Ag-Cu binary phase diagram depicting a eutectic system. Single-phase regions are purple and two-phase regions are white. Adapted from ASM International Diagram No. 105003. Neyoro™ 28 (Ag-Au) and Pt-10Ir (Pt-Ir) are examples of miscible alloys; the elemental components can occupy any crystal lattice position and are completely soluble at any concentration and temperature. Figure 1 depicts the Ag-Au binary diagram that is archetypal of miscible systems. There are only three equilibrium phase regions within the temperature range of interest at one atmosphere: a liquid phase (L), a disordered phase (Ag,Au), and a two-phase region (L+(Ag,Au)). Binary systems do not typically melt at a single temperature and the liquid and solid phases coexist over a range of temperatures for a given composition. This range is bound by the liquidus curve, above which the entire material is liquid, and the solidus curve, below which the entire material is solid.

Figure 1: Annotated Ag-Au binary phase diagram depicting a fully miscible with an insert magnifying the L+(Ag,Au) two-phase region. Single-phase regions are purple and two-phase regions are white. Adapted from ASM International Diagram No. 105001.
Eutectic Systems — The liquidus temperature of eutectic systems, like Ney 90 (Ag-Cu), decreases with increasing solute until a local minimum is achieved¹, this is referred to as the eutectic point, as seen in Figure 2. When the liquid is cooled below the eutectic isotherm, both solid phases form cooperatively out of the melt (L→Ag+Cu). This can engender a unique two-phase microstructure of alternating Ag phase and Cu phase sheets called lamellae. These phases are in equilibrium and no amount of thermal treatment will create a single-phase. Ney 90 is hypo-eutectic (L → L+Ag → Ag+Cu) and precipitates primary Ag before eutectic solidification. The line separating the Ag and Ag+Cu regions (and, more generally, all single-phase and multiphase regions) is called the solvus. Thermal treatments above the solvus temperature will dissolve the Cu phase into solid solution, and aging the solvus it will result in Cu precipitation.

Figure 2: Annotated Ag-Cu binary phase diagram depicting a eutectic system. Single-phase regions are purple and two-phase regions are white. Adapted from ASM International Diagram No. 105003.
Peritectic System — Peritectic reactions often occur when there is a large melting point difference between components, as observed for Paliney® 1100 (Pd-Re), Figure 3. During equilibrium solidification, a solid (Re) and the liquid (L) react at the peritectic isotherm to engender a different solid phase (Pd). This is called a peritectic reaction (L+Re → Pd)². The rate at which the liquid solidifies strongly influences the solidified microstructure and faster rates can retain Re phase particles. Paliney 1100 does not pass through the peritectic region and solidifies into a single Pd phase³.
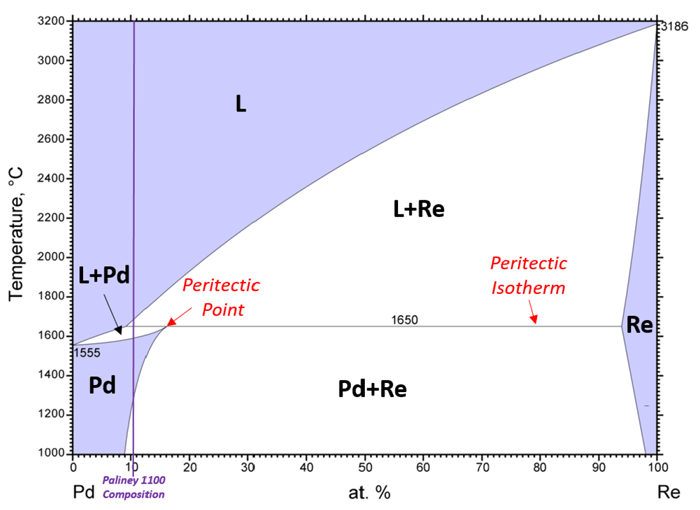
Figure 3: Annotated Pd-Re binary phase diagram depicting a peritectic system Single-phase regions are purple and two-phase regions are white. Adapted from ASM International Diagram No. 901879.
Complex Systems — The binary phase diagrams for precious metal alloys are often simple, like the ones presented above. However, more complicated binary phase diagrams exist. Figure 4 depicts the phase diagram for Alloy 8010 (Pd-Ga based). Although the diagram is noticeably more complex, the same interpretation rules discussed above apply. It should be noted that the composition line is for the Pd:Ga ratio as Alloy 8010 has seven constituents. Most binary mixtures form intermetallic compounds which can be either nonstoichiometric or stoichiometric; signifying that their single-phase region exists over a range of compositions or at a single point, respectively. This diagram also has several congruent transformations where one phase transforms into another without a change in composition.
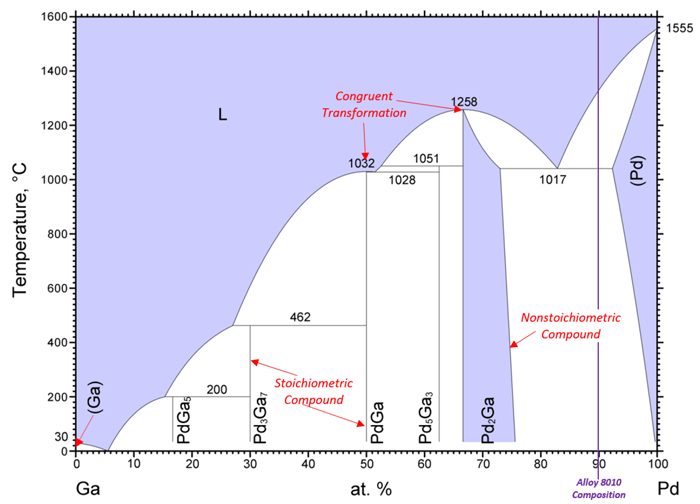
Figure 4: Annotated Pd-Ga binary phase diagram. Single-phase regions are purple and two-phase regions are white. Adapted from ASM International Diagram No. 200283.
References:
[1] D.A. Porter, K.E. Easterling, 4.3.2 Eutectic Solidification, in: Phase Transformations in Metals and Alloys, Second Edition, Chapman & Hall, 1997: pp. 222–229.
[2] W. Callister, Eutectoid and Peritectic Reactions, in: Materials Science and Engineering and Introduction, 7th ed., John Wiley and Sons, Inc., 2007: pp. 284–286.
[3] D.M. Stefanescu, Peritectic Solidification, in: Science and Engineering of Casting Solidification, 3rd ed., Springer International Publishing, 2015: pp. 247–263.