Issue 011, June 20, 2021
Grant G. Justice, Senior R&D Metallurgist
The melting behavior of a metal is commonly measured by identifying the discontinuity in the heating curve associated with the phase change from solid to liquid. This phenomenon can be easily examined at home with a piece of ice. For example, if you measured the temperature of ice sitting out in room temperature air, you would see gradual heating of the ice to 0°C, then you would see the temperature hold steady at 0°C before the ice resumes heating to room temperature. This plateau results from the heat absorbed by the ice to overcome the energy required for the phase change or the enthalpy of melting.
This simple experiment is at the core of modern melting measurement techniques. Measurement of the melting behavior of metals is generally conducted by a differential scanning calorimeter (DSC) in a system similar to that illustrated in Figure 1. The sample is loaded into a crucible placed opposite a second, empty reference crucible located in the center of a furnace. The furnace is then heated at a constant rate. A thermocouple monitors the temperature of both crucibles, and then the heating profile of the two crucibles is recorded and compared. During melting, there will be a deviation in temperature between the reference and the sample, and from this deviation, the melting behavior can be determined. Based on the magnitude of the deviation in temperature from the reference, the heat flow is determined, normalized to the sample mass, and reported as heat flow per mass, usually mW/mg. More details on the setup and data analysis of differential scanning calorimeters can be found in references 1 and 2.
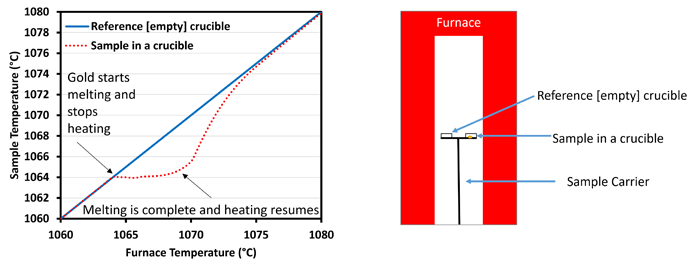
Figure 1: Schematics of a general DSC configuration and a general raw temperature profile for gold.
Melting behavior from the DSC curve is characterized by three values: solidus, or start of melting, liquidus, or end of melting, and the enthalpy of melting.
- The solidus is measured as the temperature at which the heating behavior of the sample deviates from steady state. A DSC curve is determined by the intercept of a pair of tangent lines, as shown in Figure 2.
- The liquidus is when the sample is no longer accepting additional heat from the furnace and has returned to equilibrium. It is also measured by determining by the intercept of a pair of tangent lines, as shown in Figure 2.
- The enthalpy of melting is the total energy required to melt a sample. It is determined by finding the area of the melting peak, as shown in Figure 2. An accurate enthalpy of melting measurement can be challenging to collect and is usually not reported.
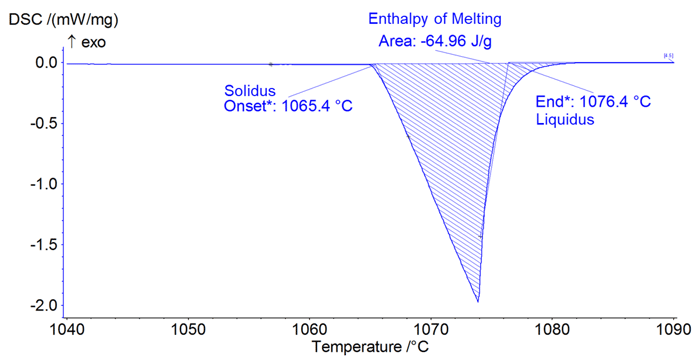
Figure 2: Example Analysis of pure gold melting.
The melting curve in Figure 2 for pure gold is representative of what is often the result of an industrial grade DSC of recent manufacture. The most obvious issue is that a pure metal like gold should have a single melting temperature where the solidus and the liquidus are the same. However, this sample exhibits a 10°C difference between the solidus and the liquidus due to measurement lag. This results directly from the lag between the true sample temperature and the measured thermocouple temperature. The temperature is measured at the thermocouple tip, separated from the sample by the sample carrier platform and the crucible, as seen in Figure 3A. Additionally, the sample is usually smaller than the crucible, so it may not sit directly above the thermocouple tip. Lastly, the sample will develop a thermal gradient from surface to the core that is more pronounced when a large sample is used. All of these barriers can result in a significant lag between the thermocouple and the sample temperature.
The effect of measurement setup on lag can be seen in Figure 3B on a single sample of pure gold at a heating rate of 5, 10, and 20°C/min. From the data, it is clear that the solidus is the most consistent between all three measurements; however, the liquidus and enthalpy are all significantly changed by the heating rate. An increase in the sample mass also tends to result in increased liquidus and enthalpy measurements. This effect of lag is even more relevant for the measurements of alloys of metals that will have a melting range, making measurement of an accurate liquidus important. Thermal lag will always decrease the accuracy of the liquidus temperature of alloys.
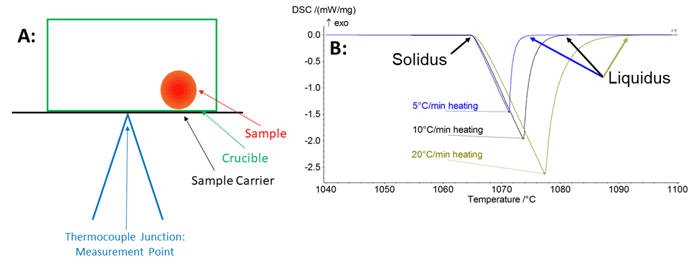
Figure 3 A: Example of sample loacation vs thermocouple location causing thermal lag, B: Measurements of gold with identical sample and machine configuration collected with heating rates of 5, 10, and 20°C/min
With proper calibration and understanding of the effects of measurement setup on thermal lag, melting measurements of acceptable quality can be made on currently available equipment.
References:
[1] Bhadeshia, “Differential Scanning Calorimetry: Introduction.” https://www.phase-trans.msm.cam.ac.uk/2002/Thermal2.pdf
[2] Lukas, Kevin, and Peter K. LeMaire. “Differential scanning calorimetry: fundamental overview.” Resonance 14.8 (2009): 807-817. https://www.ias.ac.in/article/fulltext/reso/014/08/0807-0817